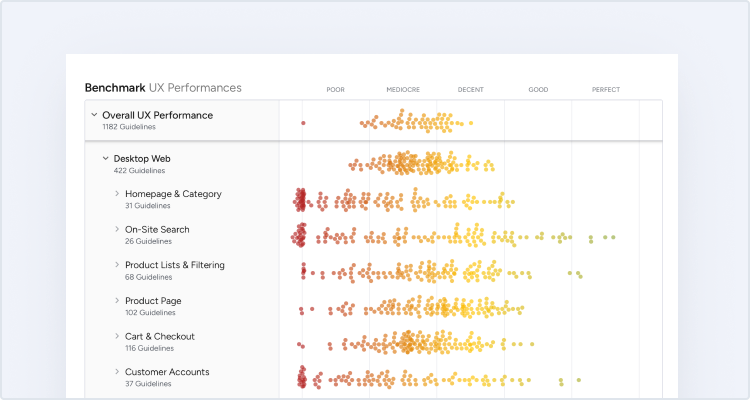
42 ‘Direct To Consumer’ Sites Ranked by User Experience Performance
Use the interactive UX benchmark chart below to see the ranked UX performance of 42 leading Direct To Consumer e-commerce sites in the US and Europe – covering both larger DTC brands and smaller niche DTC players. Each of the 42 Direct To Consumer sites has been manually rated across 485 different e-commerce UX elements, all based on Baymard’s 150,000+ hours of UX research.
This is a sub-set of the full benchmark which includes 280 ecommerce sites.
Case Studies
Click the colored dots to view in-depth case studies for each benchmarked site, or scroll down to see all case studies. You can also view the case study examples organized by type of page.
Overall UX Performance
485 Guidelines
Desktop Web
294 Guidelines
Homepage & Category
38 Guidelines
Product Lists & Filtering
48 Guidelines
Product Page
64 Guidelines
Cart & Checkout
110 Guidelines
Customer Accounts
34 Guidelines
Mobile Web
191 Guidelines
‘Direct To Consumer’ Case Studies
Deep dive into the performance and page designs of the 42 case studies.
Direct-to-Consumer Research
At Baymard Institute we have a whole research topic devoted to online shopping UX and usability, specifically for online Direct-to-Consumer sites.
View Research TopicBrowse Benchmarks by Industry or Site Type
Select an option below to see a UX benchmark collection specific to your business, or see all 280 case studies.
Industry
User Experience Research, Delivered Weekly
Join 60,000+ UX professionals and get a new UX article every week.

Explore Other Research Content

300+ free UX articles based on large-scale research.

18,000+ annotated designs for systematic inspiration.

Code samples, demos, and key stats for usability.

